Hi everybody,
I wanted to see if the barometer of my Tello produces reliable values.
I am writing a Python program to read the status string and test several functions.
This program is not yet ready to be published, so my program may be the source of trouble.
During the test I let Tello go up and down 200cm.
I read out selected values and copied them into a spreadsheet.
Along with the status string I record the commands given.
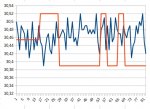
I calculated an additional curve which goes up and stays up when I climb
and goes down and stays down when I sink. It is related to the altitude.
In my diagram it is the red curve. When it is up, the pressure should be low and vice versa.

The blue curve is the baro value as obtained from Tello (in which units?).
The x-axis shows the time in seconds.
It does not look convincing at all.
You might ask if you can get meaningful values from a barometer when you move up and down 2 meters.
The answer is: Oh, yes!
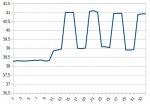
For comparison, I attach a diagram I made with the pressure sensor of my mobile, holding it high and low with my hand,
i.e. approx. 2 meters as well.

(Luft = air, Druck = pressure, given in hPa which is approx. the same as the old millibar)
Btw, the app I used to make this diagram is phyhox, a really cool app.
So, the conclusion is:
Maybe my program is faulty, I keep looking for errors.
If it is OK, I will soon release it. It will be called TelloCommander.
And if it is OK, the baro sensor of my Tello produces garbage.
I would like to know if you get similar results.
I wanted to see if the barometer of my Tello produces reliable values.
I am writing a Python program to read the status string and test several functions.
This program is not yet ready to be published, so my program may be the source of trouble.
During the test I let Tello go up and down 200cm.
I read out selected values and copied them into a spreadsheet.
Along with the status string I record the commands given.
I calculated an additional curve which goes up and stays up when I climb
and goes down and stays down when I sink. It is related to the altitude.
In my diagram it is the red curve. When it is up, the pressure should be low and vice versa.

The blue curve is the baro value as obtained from Tello (in which units?).
The x-axis shows the time in seconds.
It does not look convincing at all.
You might ask if you can get meaningful values from a barometer when you move up and down 2 meters.
The answer is: Oh, yes!
For comparison, I attach a diagram I made with the pressure sensor of my mobile, holding it high and low with my hand,
i.e. approx. 2 meters as well.

(Luft = air, Druck = pressure, given in hPa which is approx. the same as the old millibar)
Btw, the app I used to make this diagram is phyhox, a really cool app.
So, the conclusion is:
Maybe my program is faulty, I keep looking for errors.
If it is OK, I will soon release it. It will be called TelloCommander.
And if it is OK, the baro sensor of my Tello produces garbage.
I would like to know if you get similar results.


